30-second summary
- In youth soccer, data educates: it is for following the player’s development, not for judging the result.
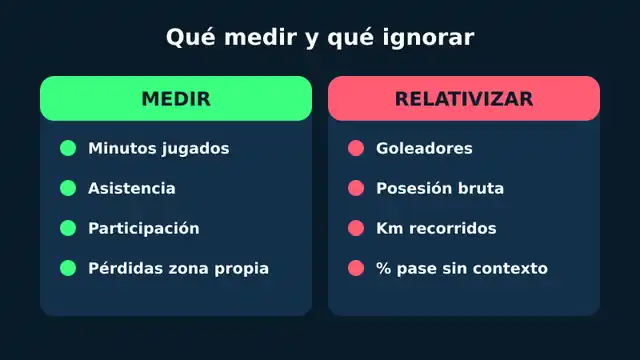
- Worth tracking: minutes played, attendance, involvement in team play, losses in your own half and dribble or 1v1 attempts.
- Take with a pinch of salt: goals and top scorers, raw possession, kilometres and top speed, cards and pass completion without context.
- Adapt the amount of data to the age group and start with a simple base of three or four variables.
- Keep the same criteria all season and communicate the data carefully.
Anyone who has coached an under-12 or under-16 team knows the problem is not a lack of data, but too much noise. Some coaches jot down goals, cards and minutes in a notebook, while others try to record twenty variables per match without any of them changing Tuesday’s session. Youth soccer stats only make sense if they answer a developmental question: is this player improving? Is my game model working? Am I distributing minutes fairly?
In this article I explain, from the field and not just from the office, which metrics are worth recording by age, which are best ignored because they distort the coach’s view, how to set up a simple system and how to avoid the most common mistakes. I also clarify what a football statistics database is and how to adapt it to a youth club.
Why youth soccer stats are not the same as professional soccer stats
In professional soccer, data is used to decide signings, prepare opponents and optimise performance. In youth soccer, the main function is educational and for monitoring development. That difference changes everything.
The result is a poor indicator of learning
An under-10 team can win 6-0 because it has two players who matured physically earlier, and another can lose 3-1 while playing a clean build-up from the goalkeeper. If you only look at the scoreboard, you reward early maturation and punish the process. The data worth having in development is what measures repeatable behaviours, not outcomes influenced by chance or biological maturation.
Relative age bias
It is a phenomenon widely described in the youth sport literature: players born in the first months of the selection year tend to be over-represented in elite youth teams. Any statistic that favours strength, speed or height (duels won, second-ball goals, long runs) amplifies that bias. That is why numbers should be read with the date of birth in front of you.
Small samples, fragile conclusions
With 20 or 25 matches per season and constant rotation, any percentage is unstable. A player with 40% pass accuracy after three matches is not worse than another with 60%. Before drawing conclusions, you need trends over several weeks.
The stats that are worth tracking
These metrics are easy to record from the touchline or with video, and they connect directly to training decisions.
Minutes played and involvement
It is the most underrated statistic. Recording minutes per player, per position and per match lets you check whether you are meeting your own distribution criteria. Many federations and youth leagues have minimum-participation rules, and in any case it is a matter of fairness to families. A simple count of accumulated minutes avoids surprises mid-season.
Attendance and consistency in training
Attendance explains more progress than any match data. Track monthly attendance percentage and cross it with technical progression: you will almost always find the cause of a plateau before touching tactics.
Involvement in team play
Instead of goals, record actions that build play: completed forward passes, receptions on the half-turn, line-breaking passes, crosses from dangerous areas. With one observer and a manual count sheet, three or four key actions per match are enough.
Losses in your own half
It is a risk-management metric that matters a lot in the early stages of playing out from the back. Counting losses in the defensive third and how many end with the opponent shooting lets you assess whether your game model is being executed with judgement or whether you are asking for something the group doesn’t master yet.
Dribble attempts and 1v1 duels (with a caveat)
At developmental ages, tracking attempts matters more than success. A player who tries to take on a defender eight times and succeeds three is learning; the one who never tries for fear of losing the ball has an environment problem, not a technique problem.
Stats worth ignoring (or taking with a big pinch of salt)
Goals and top-scorer tables
Top-scorer rankings reinforce the fixation on results and make defenders, midfielders and goalkeepers invisible. Record goals, of course, but don’t make them the centre of the conversation with players and families. And look more at chances created than at goals scored.
Raw possession
Possession as an isolated percentage says little. A team can have 65% without creating anything because it passes sideways, or 40% while being very effective in transition. It only has value if you cross it with progression and chances.
Kilometres covered and top speed
In youth categories, this GPS data reinforces maturation bias and produces comparisons of little use. Except in high-performance settings with load control supervised by qualified staff, they are not a priority for a normal youth club.
Cards as an indicator of character
Bookings depend heavily on the referee’s judgement, which varies enormously in youth categories. Use them as an occasional behaviour alert, not as a monitoring statistic.
Pass completion without context
A 90% completion rate can mean the player only passes backwards. If you don’t distinguish direction, zone and difficulty, this figure rewards comfort rather than development.
How to adapt metrics by age
It makes no sense to apply the same dashboard to an under-8 as to an under-19. This table summarises a reasonable approach.
| Age group | Measurement priority | What to avoid |
|---|---|---|
| U8 and U10 | Minutes played, attendance, involvement in play | Goals, standings, any ranking |
| U12 | Actions with the ball (passing, carrying, 1v1), minutes by position | Isolated pass percentages |
| U14 | Losses in own half, progression, decision-making | Physical comparisons between players |
| U16 | Team effectiveness, chances created and conceded, set pieces | Public individual rankings |
| U18-U19 | Performance by role, opponent analysis, competitive minutes | Physical data without technical supervision |
The core idea: the younger the age, the less data and the more qualitative. From U16 on, competition already justifies somewhat more quantitative analysis, always in the service of learning.
How to set up a simple football statistics database
When people talk about a football statistics database, many think of big professional platforms. In youth soccer, the useful version is much more modest: an orderly, consistent record of the team’s matches and training sessions that you can consult and compare across the season.
What a football statistics database in Excel is
It is a spreadsheet workbook where each row represents a player in a match (or a whole match) and each column a variable: date, opponent, minutes, position, goals, assists, losses, and so on. Its advantage is that it is free, flexible and compatible with pivot tables. Its limit is that it depends on the discipline of whoever fills it in and gets awkward with large squads or several teams.
Recommended minimum structure
- Players sheet: name, date of birth, usual position, age group.
- Matches sheet: date, opponent, result, home or away, competition.
- Records sheet: one row per player and match, with minutes and the three or four chosen metrics.
- Summary sheet: pivot tables with totals and moving averages.
When to move to a dedicated tool
If you manage more than one team, need to share data with other coaches or lose hours copying notes from the notebook to the computer, it makes sense to use an app designed for it. To track soccer match statistics quickly from the bench, tools like the one described in track soccer match statistics avoid duplicated work and keep the history organised. What matters is not the tool, but that the record is consistent.
How to record data without missing the match
The problem of the coach who writes everything down
In practice, a coach running the bench can’t observe and record more than two or three variables at once without losing information about the game. My recommendation: choose a maximum of three metrics per match and rotate the focus every month.
Sharing roles
If you have an assistant coach, a team manager or a collaborating parent with clear instructions, assign them the count of one specific action. One observer, one variable. Define before the match what counts as a valid action: a progressive pass, for example, needs a written criterion, or each person will count something different.
Video as an ally
Recording the match with a tripod from an elevated spot lets you review afterwards and record at your own pace. Before recording, check data protection and image rules for minors: you need families’ consent and use restricted to educational purposes, with no public distribution.
How to communicate data to players and families
A poorly communicated statistic can do more harm than having none. These principles work in practice:
- Compare the player with themselves, not with teammates. “You’ve gone from 2 to 5 dribble attempts” motivates; “you’re the one who dribbles least” demotivates.
- Use data in private for individual feedback and in a group only for collective objectives.
- Translate the number into behaviour. With an under-12, “we lost four balls in our box” becomes “today we’ll look for a safe pass when they press us”.
- Avoid public rankings. At early ages, any ordered list ends up turning into a label.
- With families, explain at the start of the season what you measure and why, and stress that minutes and participation are part of the plan.
Common mistakes when working with youth soccer stats
- Measuring for the sake of measuring. If a metric doesn’t change any decision, drop it.
- Changing criteria mid-season. You lose comparability and the history becomes useless.
- Ignoring context. 45% of duels won against an opponent with two more years of maturity is not a bad figure.
- Confusing correlation with cause. The striker scoring more when full-back X plays doesn’t mean the full-back is the reason.
- Using data to label. A number doesn’t define an eleven-year-old; it describes a trend at a specific moment.
- Not reviewing on a fixed schedule. Spend 30 minutes every two or three weeks looking at trends, not after every match.
A practical case: from the notebook to the decision
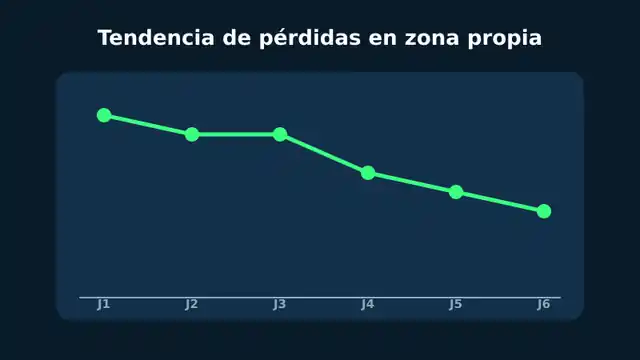
Imagine an under-14 team that strings together three narrow defeats. The coach, who only looked at goals, suspects the attack. After recording losses in the defensive third and progressive passes for four matchdays, he discovers the problem is in the build-up: 60% of the balls lost in their own half end in an opponent shot. The weekly session changes: rondos with orientation, positional games with superiority and an adjustment to the support given to the centre-back. Within six weeks, losses in their own half drop clearly and the team is competing again.
This is what a well-designed data system provides: it doesn’t give you the answer, but it points you to the right question. The decision is still the coach’s, based on his observation and knowledge of the group.
Conclusion
Youth soccer stats are a tool that supports development, not a scoreboard. Track minutes, attendance, involvement in play, losses in your own half and attempts at technical actions. Downplay goals, raw possession, physical data, cards and pass percentages without context. Adapt the amount of data to the age group, keep the same criteria throughout the season and communicate results in terms of individual improvement.
Start with a simple football statistics database of three or four variables, and expand it only when you see that each piece of data changes something in your daily work. That way numbers stop being noise and become what they should be: a help for developing better players and better people.