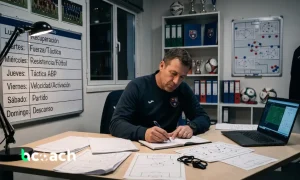
Football is no longer a discipline guided solely by dugout intuition. Today, data-driven decision-making is firmly established at the elite level as well as in academy and amateur football. Applying methods for tracking football match statistics enables any coaching staff to transform abstract impressions into tactical certainties. It is no longer just about knowing who held possession, but understanding how, where, and why the ball is used across every phase of the game.
For years, many coaching staffs recorded only baseline numbers like goals, shots, or corner kicks. The current challenge is not collecting as many metrics as possible, but filtering out the ones that genuinely illuminate team performance. In this article, we dive deep into different data collection systems—from traditional tally sheets to computer vision driven by artificial intelligence—so you can choose the right setup for your club’s needs.
Why Tracking Everything Reshapes How You Manage
Performance analysis has changed dramatically. Data no longer serves merely to build post-match reports; it has become an active, real-time tactical tool. Tracking match events on the pitch delivers distinct competitive advantages:
- Objectivity in performance reviews: Eliminates emotional bias driven by the final scoreline or post-conceding frustration.
- Spotting opposition patterns: Accelerates the identification of recurring attacking routines or structural defensive flaws in the opponent.
- Optimizing tactical and physical load: Helps calibrate weekly training demands according to actual matchday physical output.
- Sharper individual player feedback: Enhances player buy-in by presenting quantitative evidence backed by game context.
Key Methods for Tracking Football Match Statistics
There are multiple workflows to gather and process matchday data. Selecting the right system comes down to club budget, available staff time, and the level of analytical detail your technical staff requires.
1. Manual Notation (Quantitative Tally Sheets)
The classical approach, yet still widely relevant. It involves paper or static digital templates (Word/Excel) mapped across pitch zones and game phases. During the 90 minutes, an analyst or assistant coach marks tallies by hand whenever a target event occurs.
- Pros: Zero financial investment and no tech reliance. Perfect for grassroots setups or clubs on tight budgets.
- Cons: High margin of human error due to the speed of the game. Fails to record complex spatial metrics such as defensive compactness or pressing intensity.
2. Streamlined Digital Collection via Dedicated Apps and Software
This approach uses touchscreen tablets or smartphones loaded with purpose-built tools for tactical management and live match tagging. It lets you log core actions (possession time, completed passes, recoveries, and turnovers by zone) with simple taps on the screen.
Bringing a football match statistics tracking app into the technical area streamlines data entry on the fly. This method blends the immediate speed of manual notation with the power to produce interactive pitch diagrams, foundational heatmaps, and automated half-time summaries instantly.
3. Post-Match Video Tagging (Eventing)
This approach requires recording the match with an elevated tactical wide-angle camera and coding the footage post-game using specialized video tagging software. The analyst reviews the match, adding timestamps and spatial coordinates to every individual and collective event.
- Data Depth: Allows you to pause, rewind, and re-examine sequences as needed to guarantee high accuracy.
- Complex Variables: Enables tracking of advanced metrics such as key passes, final-third entries, and Expected Goals (xG).
4. Optical Tracking and AI Computer Vision
The leading standard across modern professional football. Using fixed in-stadium optical tracking cameras or computer vision algorithms applied to broadcast feeds, AI automatically tracks all 22 outfield players and the ball at 25 frames per second.
Through computer vision, the platform captures uninterrupted 2D/3D spatial coordinates without requiring manual inputs. This generates complex spatial-tactical metrics, including inter-line distances, defensive block compactness, and Passes Per Defensive Action (PPDA).
5. Physical Monitoring via GPS and Accelerometers
Unlike ball-event or tactical tracking methods, physical monitoring relies on wearable sensor units housed in player vests. These units quantify the total volume and mechanical intensity produced by each player during the match:
- Total distance covered and breakdown across velocity bands.
- High-speed running and sprint metrics (efforts above 24 km/h).
- High-intensity accelerations and decelerations, central to evaluating neuromuscular load.
- Injury risk mitigation: Highlights when players exceed their acute workload thresholds.
Essential Metrics to Track Across Each Phase of Play
Not every metric carries the same strategic weight. To keep your data collection targeted, categorize key performance indicators across three tactical dimensions:
Attacking Phase Metrics
- Final-Third Entries / Passes: Evaluates the team’s ability to progress through lines and establish possession in dangerous zones.
- Expected Goals (xG): Quantifies the underlying quality of created chances based on shot location, assist angle, and defensive pressure.
- 1v1 Dribble Success Rate: Gauges individual ability to eliminate direct markers and destabilize defensive lines.
- Completed Crosses: Ratio of deliveries into the penalty area that result in an attacking touch or shot on goal.
Defensive Phase Metrics
- Final-Third Ball Recoveries: Evaluates the efficiency and coordination of an aggressive high press.
- PPDA (Passes Per Defensive Action): Measures pressing intensity; the lower the figure, the more proactively a team disrupts the opponent’s build-up.
- Aerial Duels Won: Essential metric when planning and evaluating matchups against direct, vertical opponents.
- Defensive-Third Turnovers: Critical safety metric that pinpoints vulnerable zones requiring immediate tactical intervention.
Transitions and Set-Piece Metrics
- Defensive Transition Recovery Time: Number of seconds the team takes to counter-press and regain possession or settle back into an organized defensive shape.
- Attacking Corner Efficiency: Percentage of delivered corner kicks that produce a clean shot on target.
Step-by-Step Guide to Implementing a Match Tracking Workflow
To successfully integrate match tracking into your weekly routine, follow this structured four-stage process:
- Pre-Match: Prioritize Core KPIs:
Avoid measuring 50 disparate variables unless you have an extensive analytics staff. Select between 5 and 8 core tactical metrics that mirror your game model (e.g., build-up passing accuracy, counter-pressing regains, and wide channel entries). - Live Match: Streamlined Event Logging:
Define clear sideline roles. If using tablet software, ensure the recording process does not pull the coach’s eyes away from active tactical decision-making. Track events across discrete time intervals (0–15, 15–30 minutes, etc.) to uncover mid-game physical drops or tactical adjustments. - Post-Match: Syncing Numbers with Video:
Raw statistics lack actionable meaning without visual context. If the data shows 15 turnovers in build-up play, turn to the video to identify the root cause: Were interior options cut off? Did the opponent shift to a man-oriented press? Were body shapes closed down upon receiving? - Training Pitch: Designing Data-Led Drills:
The analytics loop finishes out on the grass. If tracking shows poor pressing efficiency, shape the upcoming training week around conditioned small-sided games and tactical phase play targeted at pressing jumps and defensive cover.
Data Collection Methods: Feature Comparison
| Methodology | Precision Level | Cost / Resource Level | Ease of Use | Best Suited For… |
|---|---|---|---|---|
| Manual Sheets | Moderate–Low | Zero (Pen & paper) | Very Simple | Grassroots and youth academies |
| Mobile Tactical App | Moderate–High | Low (Basic software plan) | Simple–Moderate | Regional and semi-pro coaching staffs |
| Video Tagging | High | Moderate (Camera + software) | Intermediate | Semi-pro clubs and elite academies |
| Optical Tracking / AI | Very High | High (Fixed stadium hardware) | Advanced | Top-tier professional football |
| GPS / Wearables | High (Physical metrics) | Moderate–High (Hardware units) | Intermediate | Physical conditioning and load monitoring |
Common Pitfalls in Football Data Analysis
Even seasoned performance analysts can misinterpret numbers without applying critical context:
- Evaluating Possession Out of Context: Registering 70% possession does not indicate dominance if circulation is confined to side-to-side passes between center-backs without penetrating lines or threatening space behind.
- Overlooking Game State: Teams adjust their tactical posture depending on the scoreboard. A leading side naturally concedes possession and drops deeper, artificially inflating the opponent’s attacking stats.
- Drawing Conclusions from Tiny Sample Sizes: Making definitive tactical overhauls based on a single 90-minute match creates strategic whiplash. Evaluate rolling blocks of 4 to 5 matches to uncover genuine collective trends.
- Overwhelming the Squad with Raw Numbers: Handing players massive spreadsheets creates cognitive friction. Boil data down to 2 or 3 visual takeaways paired with short video clips under 10 seconds.
Practical Example: Turning a Match Stat into a Training Drill
- Logged Stat: 12 turnovers during build-up play in the last match.
- Video Breakdown: 8 of the turnovers happened when the defensive midfielder received with their back turned under immediate opponent pressure.
- Tactical Diagnosis: Closed body shape, poor back-foot scanning, and absent third-man support angles.
- Pitch Intervention: Design a 6 + GK vs. 4 small-sided game emphasizing playing out against a high press with quick one-touch layoffs to facing teammates.
- Follow-Up: Track build-up turnover metrics over the following three competitive matches to evaluate transfer.
Next Steps for Your Coaching Staff
Mastering match statistics tracking has become a fundamental coaching asset. Whether you rely on manual notation sheets or dedicated mobile tracking tools, the overarching target stays the same: making grounded, objective decisions that maximize your players’ tactical potential.
Assess your club’s available resources, commit to a sustainable week-to-week workflow, dial in your essential KPIs, and turn cold figures into match-winning training sessions on the pitch.